According to the Buffett Indicator, the Stock Market is {valuation}. Based on today's updated data, the Market Cap to GDP Ratio is {autoRatio}%.
As of today, the Total Market Index is at $${autoTMC} billion, which is about {autoRatio}% of the last reported GDP.
| Ratio = Total Market Cap / GDP | Valuation |
|---|---|
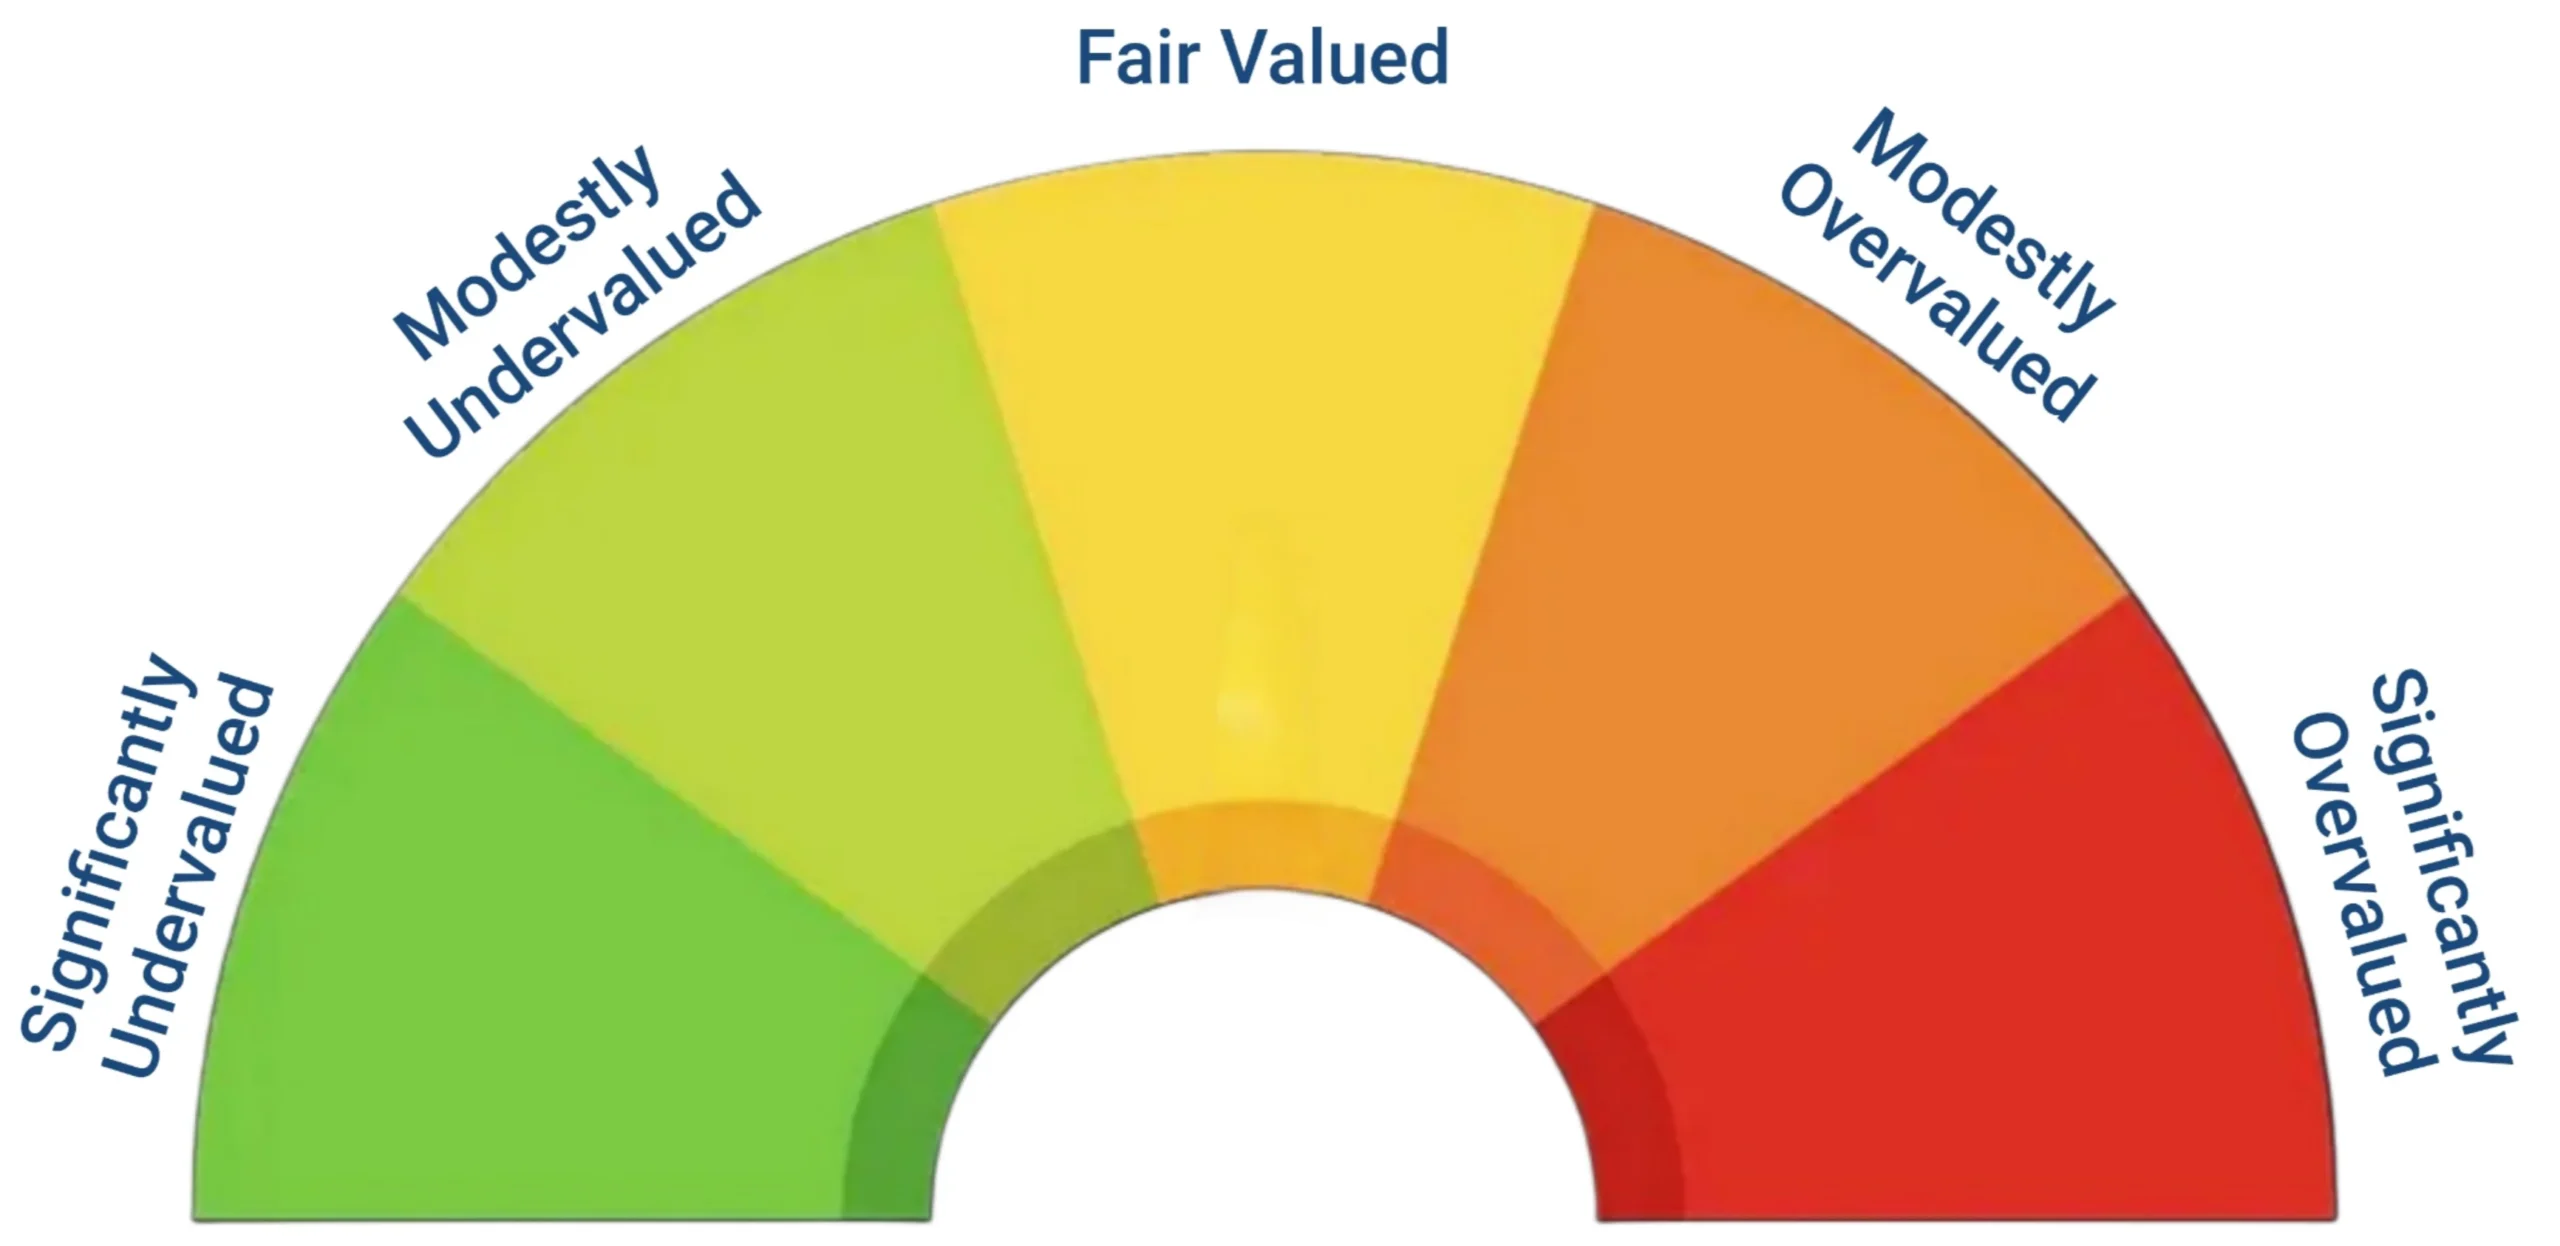
| Ratio ≤ 86% | Significantly Undervalued |
| 86% < Ratio ≤ 111% | Modestly Undervalued |
| 111% < Ratio ≤ 135% | Fair Valued |
| 135% < Ratio ≤ 160% | Modestly Overvalued |
| Ratio > 160% | Significantly Overvalued |
| Where are we today (Loading)? | Ratio = Loading, Loading |
Buffett Indicator Historical Chart
| Year High | Loading... |
| Year Low | Loading... |
| All-time High | Loading... |
| All-time Low | Loading... |
Meanwhile, based on the historical ratio of newly introduced total market cap over GDP plus Total Asset of Federal Reserve Banks, the Stock Market is {valuation}. Based on today's updated data, the Market Cap to GDP Ratio with Fed Assets is {autoTMCFED}%.
As of today, the Total Market Index with Fed Assets is about {autoTMCFED}% of the summation of the last reported GDP and Total Assets of Fed.
| Ratio = Total Market Cap / (GDP + Total Assets of Fed) | Valuation |
|---|---|
| Ratio ≤ 71% | Significantly Undervalued |
| 71% < Ratio ≤ 91% | Modestly Undervalued |
| 91% < Ratio ≤ 111% | Fair Valued |
| 111% < Ratio ≤ 131% | Modestly Overvalued |
| Ratio > 131% | Significantly Overvalued |
| Where are we today ({todayDate})? | Ratio = {autoTMCFED}%, {valuation2} |
As per latest data, the US GDP is ${gdpValue} trillion. Where Total Assets Held by All Federal Reserve Banks is ${fedAssets} trillion.
US GDP Chart
Total Assets Holding Chart
What is the Buffett Indicator?

The Buffett Indicator, named after the legendary investor Warren Buffett, is a widely used measure for assessing the overall valuation of a stock market. Officially known as the Market Capitalization-to-GDP ratio, it compares the total market capitalization of a country’s stock market to its Gross Domestic Product (GDP). This ratio offers a snapshot of how the market's valuation stacks up against the size of the economy.
Where:
- Total Market Capitalization (TMC) represents the combined market value of all publicly traded companies in a given stock market.
- Gross Domestic Product (GDP) is the total economic output of a country within a specific period, typically a year.
"Be fearful when others are greedy & greedy when others are fearful."
— Warren Buffett
That's why we launched Fear and Greed Index to help you know whether others are feeling greedy or fearful.
How Can the Buffett Indicator Help?
The Buffett Indicator is a crucial tool for investors, analysts, and policymakers, offering valuable insights into market valuation:
- Valuation Benchmark: The Buffett Indicator helps gauge whether the stock market is overvalued or undervalued compared to the overall economy. A high ratio might indicate that the market is overpriced relative to the economic output, while a low ratio could suggest undervaluation.
- Investment Guidance: Investors use the Buffett Indicator to make informed decisions about their investments. A high ratio might signal caution, suggesting that the market may be due for a correction. Conversely, a low ratio could present buying opportunities, indicating potential undervaluation.
- Economic Indicator: The ratio also provides a broad measure of economic health. Significant deviations between market capitalization and GDP can reflect shifts in investor sentiment or economic conditions, offering a macroeconomic perspective.
- Historical Comparison: By comparing the current Buffett Indicator ratio with historical data, investors can identify long-term market trends and assess whether current valuations are in line with historical norms.
How This Tool Indicates Market Valuation
The Buffett Indicator provides a clear picture of market valuation by comparing the total market capitalization to GDP. Here’s how it works:
- Ratio Calculation: The ratio is computed by dividing the total market capitalization of publicly traded companies by the GDP. This results in a percentage that represents the market’s valuation relative to the economy.
- High Ratio: A high Buffett Indicator ratio suggests that the stock market is potentially overvalued. This could indicate that stock prices are high relative to the economic output, which may lead to a market correction.
- Low Ratio: A low ratio suggests that the market is potentially undervalued. This could indicate that stock prices are low relative to the economic output, presenting potential investment opportunities.
- Market Valuation Insights: By providing a comparison between market capitalization and economic output, the Buffett Indicator helps investors understand whether the market is priced in line with the economy. This perspective helps in making investment decisions and evaluating the potential risks and opportunities in the stock market.
Sources: GDP, Total Assets
With Buffett Indicator Live, data updates every 30 seconds in real-time. After market closure, it may take up to 30 minutes to display the final day's closing Buffett Indicator US ratio.
NYSE Global Index Feed (INDEXNYSEGIS) has a 15-minute delay at the source. That's why you may notice prices changing after 9:45 AM until 4:15 PM UTC-4.